Getting caught off guard
On-chain update 18th April

That was savage and I’ll admit, I’m surprised.
I’ve been very busy at work recently so, like many of you, keeping up with a full time job and crypto is a real challenge.
I always hear about people going “full-time crypto” but for most of us that’s not practical. The problem is, there is so much information to consume that it could easily be a full-time job.
We need to be able to cut through the noise and distil from it the important signals.
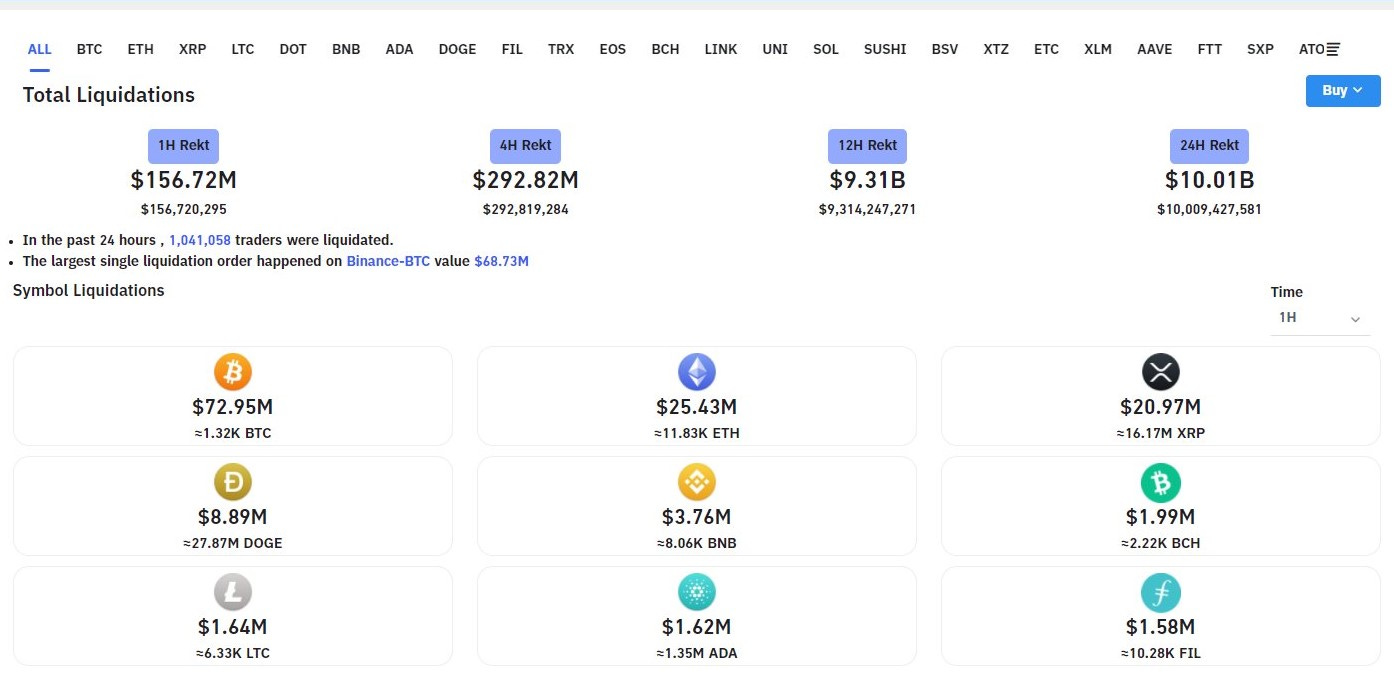
Hopefully you weren’t caught up in the record $10bn in liquidations that occurred, the highest on record.
Below I’m going to break down what’s been happening on chain last week.
Looking at where we were yesterday from a TA perspective, I had been tracking this triangle formation and was observing a retest following the deflating hype after the Coinbase listing:

So naturally I want to know what the hell led us, to this:

Bitcoin reserves on exchanges
Bitcoin flowed gradually onto exchanges throughout the early part of the week.

You can view this chart in your own CryptoQuant here.
Stablecoins went on a bit of a rollercoaster as there seemed to be some shuffling around by exchanges.
Binance makes up around 50% of the stablecoins reserves reported on CryptoQuant.
A lot of the shuffling around happened in their own BUSD reserves which make up a higher proportion than Tether, as you’d imagine:
Back to the overview, this is how Bitcoin Exchange Netflow looked, everything was completed overshadowed by the massive outflow on April 6th
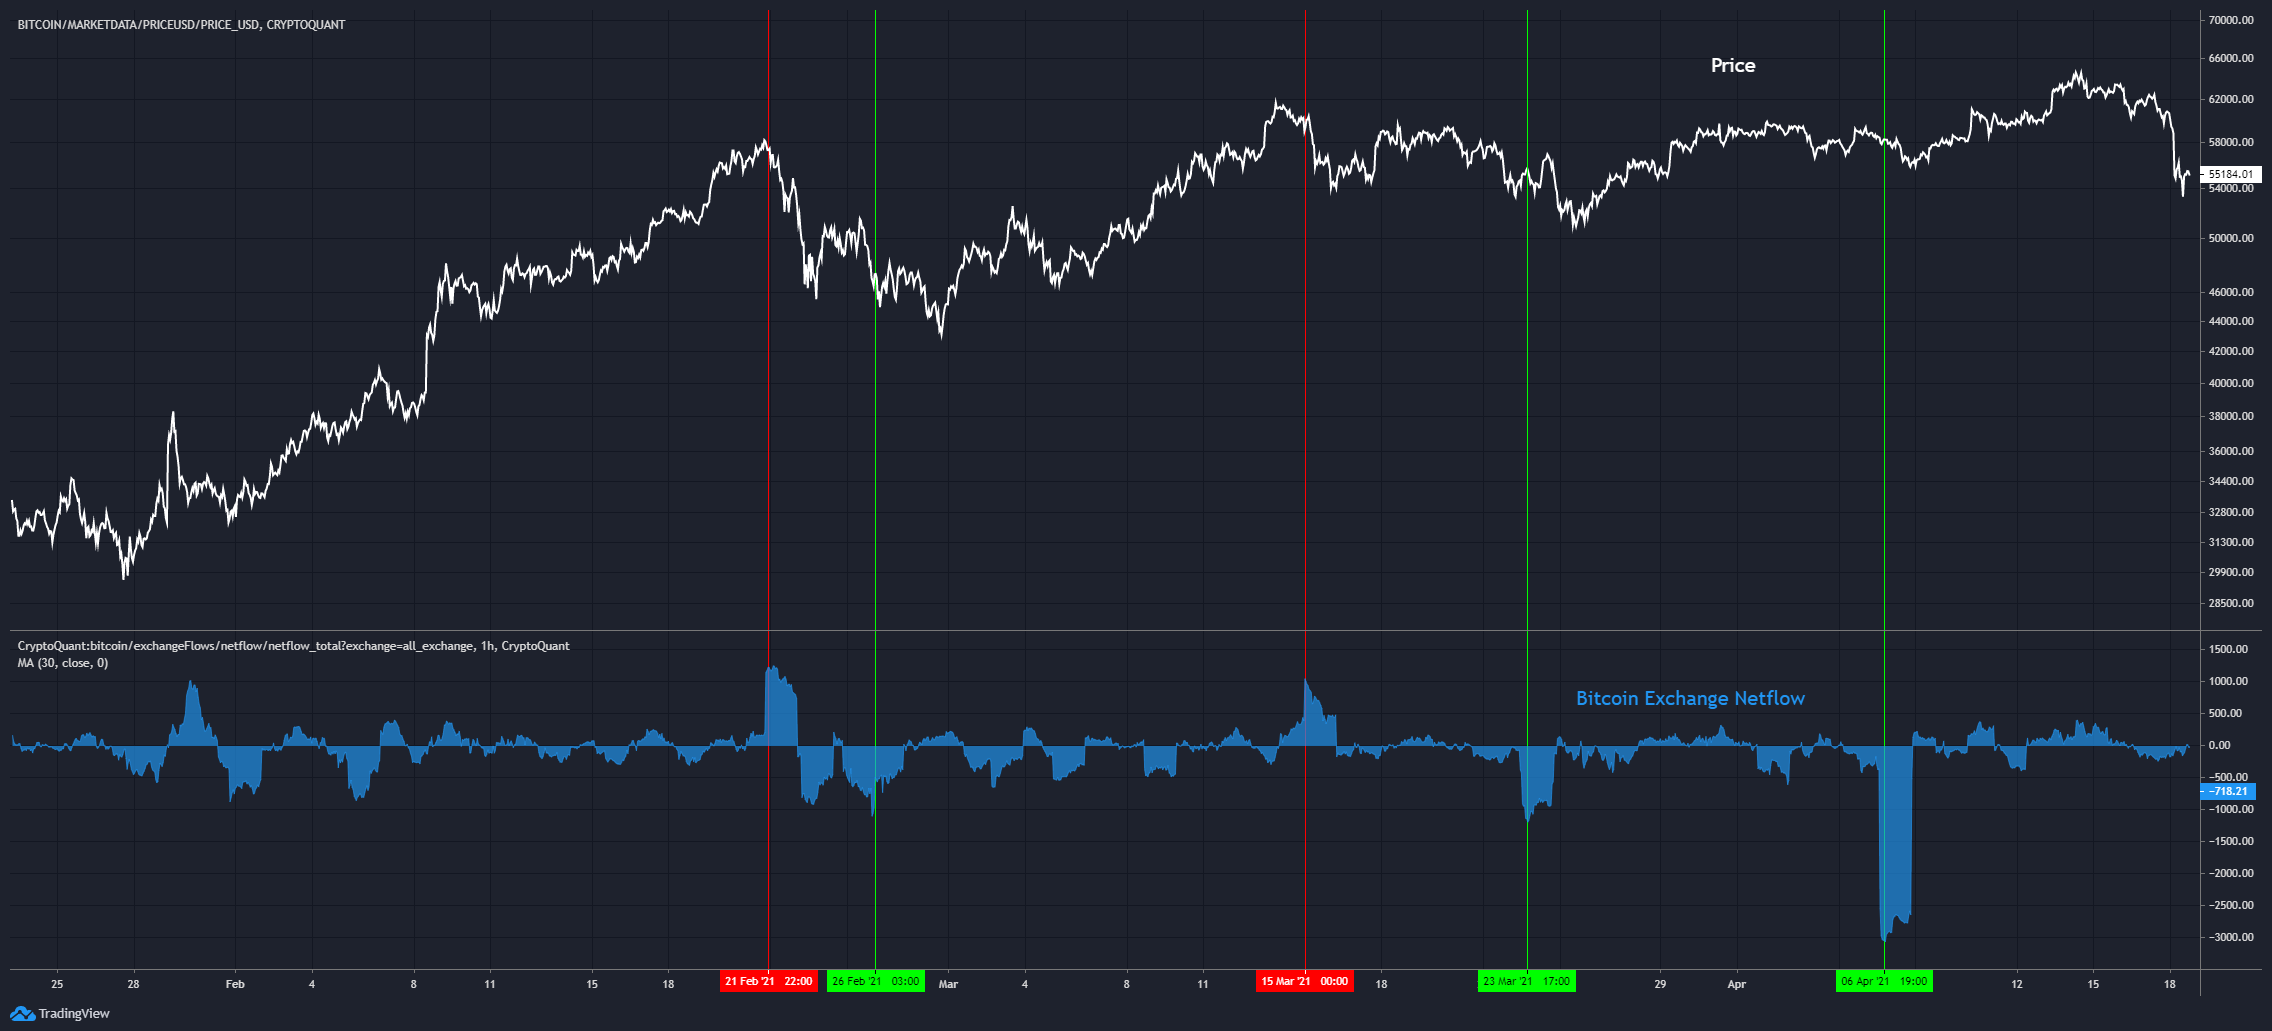
You can view this chart in your own CryptoQuant here.
The change in bitcoin reserves happened mainly in derivative exchange reserves which is where Binance is bucketed under.
Unsual inflows
Being on the lookout for unusual inflows of bitcoin onto exchanges is one way to get ahead of the next dip, especially if TA you’re doing provides confluence.
You can do this by looking at bitcoin inflow mean, and when we were pushing new all time highs around 65k, there was a large unusual inflow of bitcoin onto exchanges.

I’m not saying that this is the bitcoin that caused the dump, it might be it might not, we don’t know that from this data. What we do know is that someone sold the top, they transferred their bitcoin onto an exchange for selling.
This is the sort of signal I would have responded to, had I seen it. But as you can see from the first section on reserves, it got lost in the noise.
So how do we know that the market won’t dip further from here? That’s the million dollar question but there are some metrics that indicate that it’s a good time to be buying. Particularly SOPR.
Spent Output Profit Ratio (SOPR)
The definition of SOPR is:
The Spent Output Profit Ratio (SOPR) is computed by dividing the realized value (in USD) divided by the value at creation (USD) of a spent output. Or simply: price sold / price paid.
It tells us whether owners would be selling at a profit or at a loss. When greater than 1 it means owners would be selling at a profit.
So whenever this metric dips below 1, it’s a good indicator of a bottom and that price might not go down further since anyone selling would be selling as a loss.

Whenever this metric dips below 1, it’s called a SOPR “reset”. It means that it’s a good time to buy during a bull market because it’s unlikely that aggressive selling will continue since anyone selling would probably be making a loss. Or in other words, you’ve got a good chance of making profit if you buy here.