Sleight of hand
Breaking down the recent bitcoin accumulation and distribution


A magician never reveals his secrets.
Why not? Of course, it’s not because it’s real magic, it’s because you would realise it’s not real, it’s a trick, and there would be no more appeal.
As a child my father used to run an agency, he would book performers for clubs, bars and events like weddings.
One day we received a private performance from a magician at our home. He showed us some wonderful tricks and as a child I was fascinated.
But there was this one trick I will always remember, the linking rings.
If you’re not familiar with it, this is a trick where the rings seem to be completely solid all the way around but the magician manages to link them together. The magician seems to be able to defy the laws of physics and move solid matter.
As he performed this trick for us, in the comfort of our kitchen, he fumbled and I noticed from my vantage point, a small gap in one of the rings.
And it came crashing down before my eyes, I realised that this was indeed, just a trick and not real magic. As a child, this was devastating to me and I remember it vividly because ever since, I have been sceptical of magicians.
Over the past week, this is how I have felt about the crypto markets. From watching exchange flows of BTC and ETH during the price crash, witnessing the FUD spread in the news to further the interests of “smart money” and studying the Wyckoff distribution pattern.
In hindsight, it is so obvious to me what has occurred now since January and a certain magic has faded. I believe there has been a manipulated mark up of Bitcoin price and then a mark down. I believe I have evidence for this from on-chain data and would like to share my theory with you today along with some thoughts on where we might be headed next.
I’m @tempting_beef, back again with some technical analysis and on-chain exchange flows, cutting up past price movements and serving up predictions on where things might go next.
I’d like to get right into it with this chart which shows, at a high level, the accumulation and distribution of bitcoin by whales. Call them institutions, big players, smart money, whatever you like.

When the number of addresses holding >1k bitcoin is increasing, whales are accumulating (buying). When it is decreasing, whales are distributing (selling).
I’m going to quickly go through the accumulation phase that occurred from Jan - Feb, then the distribution phase from Feb - May and then talk about what might happen next.
We’ll also look into how some key exchange flows of bitcoin looked during these phases.
Accumulation
Applying a Wyckoff schematic to the BTC chart, we can see that there was an accumulation phase from Jan - Feb.

Some key points of interest on this chart are that Phase A looks a lot like Phase A from a distribution phase where it has a buying climax (BC) and this occurs when the accumulation is part of a longer term up-trend.
Another critical point of interest is the Spring and Test where we see high volume but small spreads in price. This tells us that demand of whales was high as they applied significant buying pressure to soak up the supply being offloaded by retail here, who expected price to break down.
Let’s take a look at exchange flows, specifically I want to point out what happened around the spring and test where the supply was soaked up.

You can see that exchange inflow mean spiked on the spring and the test, supply increased and selling pressure increased but this did not translate into a significant move downwards which tells us that there was high demand for BTC at these levels. This was a bear trap where big players were accumulating BTC at rock bottom prices preparing for the next move upwards.
Mark-up and distribution
The next set of events that unfolded were some of the most exciting we’ve seen in the crypto markets so far. Elon put #bitcoin in his twitter profile and Tesla announced the conversion of a large proportion of their balance sheet into bitcoin. This set the stage for a mark up in price and demand for bitcoin exploded, sending prices up to 60k.
A bull campaign was already in progress prior to this, the narrative was the hard money strategy, the story that bitcoin was digital gold pervaded the news and companies like Tesla and Guggenheim and Square Inc were adding it to their balance sheets.
Don’t forget about the chart showing the number of addresses holding >1k BTC, from this point forward, after the price rose to >50k, this started to decline as big players were selling.
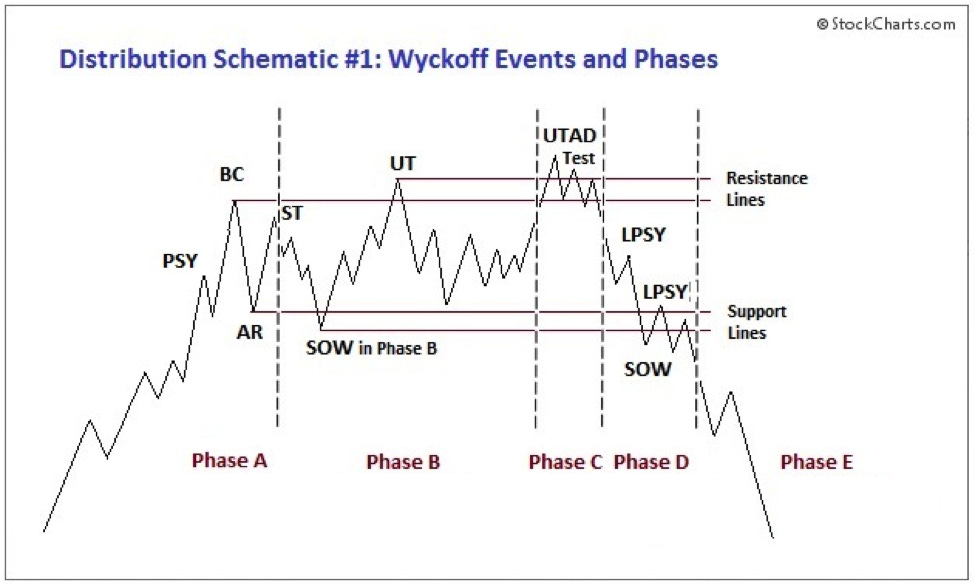
Applying a Wyckoff distribution schematic, we get a good fit with high volume after the buying climax (BC). This is where the majority of the bitcoin supply was unloaded onto the general public who were in a buying frenzy expecting to go to the moon.

This initial sell off resulted in a significant drop in the number of addresses holding >1k bitcoin, reduced from 2435 to 2365. Whales just unloaded on retail.
Let’s see what clues we could find in exchange flows that this was happening:

There were two spikes in inflow mean right when we would expect, at the buying climax (BC) and the upthrust (UT). This is where whales sold the top and there was also a significant drop in the number of addresses holding >1k bitcoin.
Furthermore, the UTAD (upthrust after distribution) occurred around the time of the Coinbase IPO. In my mind this was not a coincidence and it was designed to trap retail traders who were expecting a break out.
Looking at the end of the distribution phase, we started getting many many inflow mean spikes as whales just unloaded even more. The narrative began to change following the disappointing price action after the Coinbase IPO and a bear campaign unfolded resulting in a mark down in price.
Mark-down and what follows next
A bear campaign took hold, ignited by tweets from Elon Musk that they were suspending bitcoin purchases of their Tesla vehicles, price plummeted all the way down to 30k.
This was followed by China FUD that they were cracking down on miners and crypto trading, designed to scare retail into selling their bitcoin at a loss.
We know this because of two things:
the number of addresses holding >1k bitcoin has started to rise again and
there were huge outflows of bitcoin from exchanges during the selling around 30k-35k.

So now, the magician has revealed their secret. For me, this has taken away some of the magic from the market, but this is a good thing. It makes me look at the narrative in the news more critically and gives greater context to the exchange flows paired up with technical analysis.
Since the China FUD cleared up we’ve had some bullish news, Ray Dalio admitted to owning some bitcoin and Elon Musk and Michael Saylor met with North American miners to form the Bitcoin Mining Council and promote energy usage transparency.
It’s reasonable to assume that Wyckoff schematics will continue to be present in bitcoins price charts, they’re a long standing form of technical analysis that haven’t gone away just because analysts are aware of them.
The question is, will we see another accumulation and then mark up in price or a distribution and a further mark down in price?
We don’t know for sure yet, we have to analyse what happens in this trading range over the next few weeks and see what narrative emerges in the media.

So far, Phase A looks like an accumulation schematic with a selling climax (SC) followed by a secondary test (ST). However, don’t be wrong-footed, according the Wyckoffian theory:
“In a redistribution TR within a larger downtrend, Phase A may look more like the start of an accumulation TR (e.g., with climactic price and volume action to the downside).”
I think we just finished Phase A and are entering Phase B, pay attention to whether a narrative emerges for a price markup or mark down and whether we see a spring and test or a UTAD.
If we see a spring and test again, we would also want to see high volume and also high inflows of BTC into exchanges that don’t translate into a significant move down, this would indicate that supply has just been sucked up by big players anticipating a further move up. It’s a bear trap.
We should also see the number of addresses holding >1k BTC start to rise again and this would be the real indicator of whether whales are reaccumulating. If it continues to decline, we know they’re still distributing and another move down is likely to occur.
Stay safe out there, be patient, pay attention.
Serving up on-chain cuts
@tempting_beef
Thanks a lot! Where can one watch this "number of addresses holding >1k BTC" chart. I´m very very confused whether I buy in again or stay out. Will it go past 40K up or bounce back to 30 or 20K? Heeeeeeeeeeeeeeeeeeeeeeeeeeeeeelp
Many thanks, very elucidating, and a good enterteining read. Looking forward to more of this !