

Where is the crypto market going to go next?
On-chain update 18th March 2021

This is the start of a blog series where I want to share with you my daily ideas and analysis on the crypto market, mainly Bitcoin. Sorry in advance for the rather clickbait-y title but the aim is to maintain a pulse on the market through on-chain data and in honesty, I am trying to figure out where the market is most likely to go next.
The holy grail is of course to be able to predict market tops and bottoms because that’s where we want to take profits, make entries and hedge our risk.
I have so far been doing this by checking the same charts every day, this may seem a little boring or tiresome but from my background as an analyst I know the most important thing is to keep up to date on the basic metrics. Whilst this analysis might not seem the most advanced, I do think it is the most useful for short to medium term decisions. I intend to conduct more complex macro analyses in future but I’m still a little new to on-chain data so this is as much a learning curve for me as it is for you.
Any feedback, good or bad, is completely welcome - we’re all here to learn. In fact, that’s why I’m doing this because I have found the best way I learn is by teaching others what I know or sharing my findings. The act of writing it down and putting my ideas out in the wild is the best learning experience and I hope some of you can teach me a thing or two in the comments section.
The information I’m going to share revolves mainly around the following things:
Exchange flows of Bitcoin, Ethereum and Stablecoins.
Movement of Bitcoin, Ethereum and Stablecoins that doesn’t occur on exchanges.
The activity of miners, whether they are selling or hodling.
The derivatives market, funding rates and open interest.
Grayscale holdings and the Grayscale Effect (thank you @MrBenLily).
Enough with the jibber jabber, I hope you like charts.
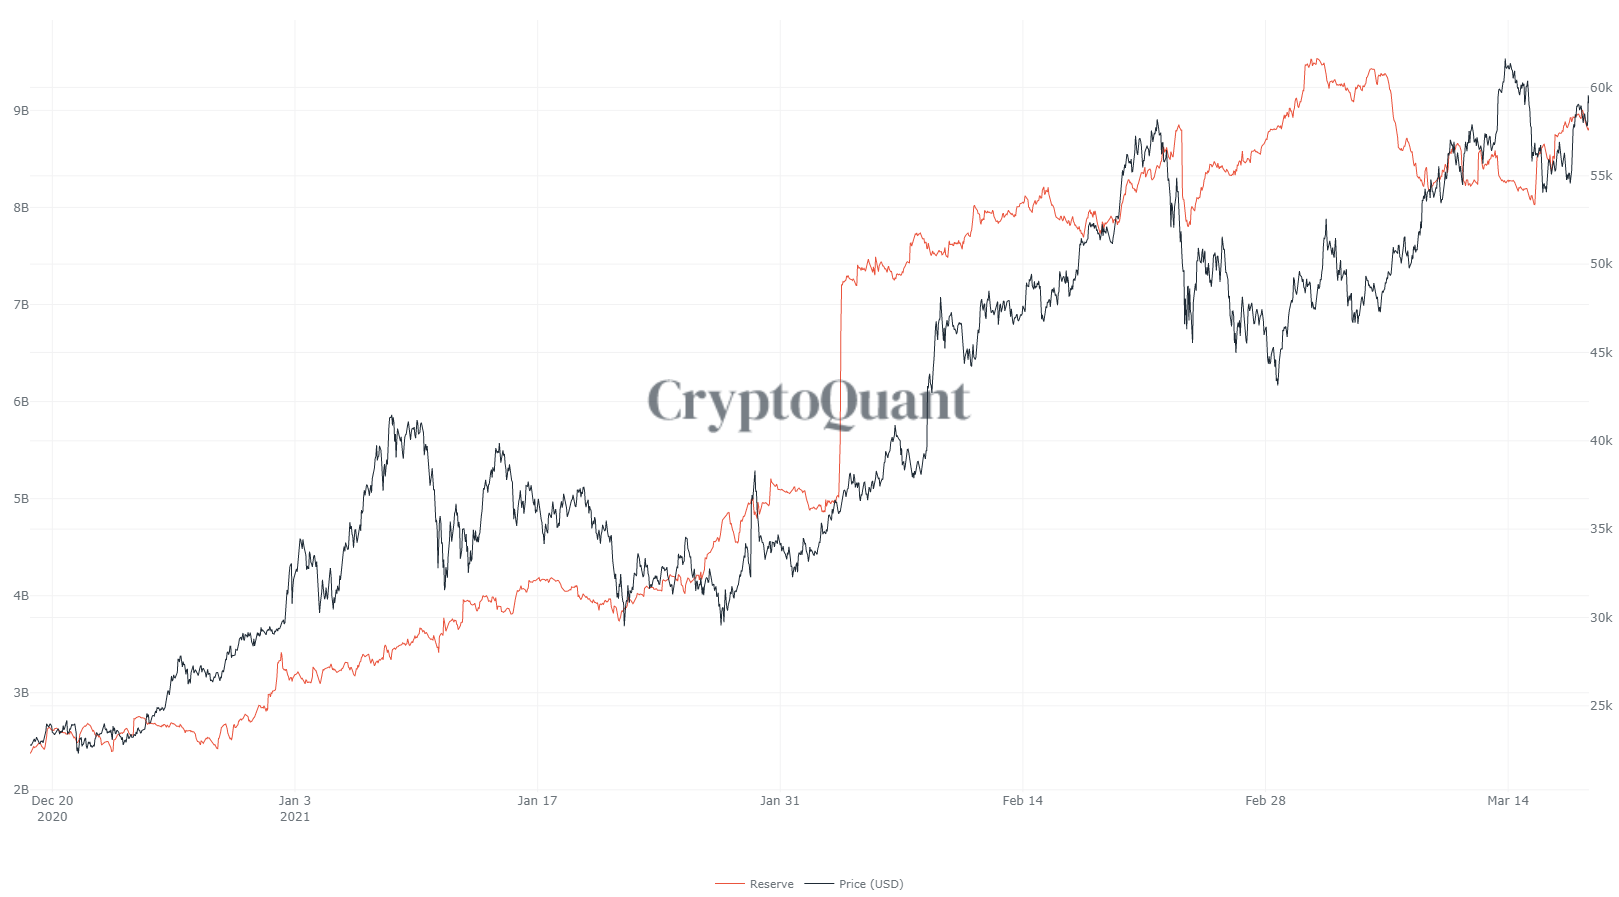
Exchange Reserves of Bitcoin and Stablecoins
Exchange reserves of Bitcoin and Stablecoins are probably the most important metrics I’m interested in checking every day. I’m not from TradFi but I do find it amazing and fascinating that we have access to this sort of data made possible by the blockchain - long live the blockchain!
For me it’s quite simple, if Bitcoin Exchange Reserves, that is, the amount of Bitcoin held in exchange wallets increases then it’s bearish because people are transferring Bitcoin onto exchanges and so they can only be doing one thing, they have come to sell.
Stablecoin Exchange Reserves is the opposite, if I see that increasing then it’s bullish because it is going to be used by traders to purchase Bitcoin.
Here’s BTC Exchange Reserves since December 2020 (orange line):

Focussing in on the most recent activity, on the initial run up to 60k we saw exchange reserves increase and it hasn’t really dropped since then. If you’re into this sort of thing and been on Twitter, you may have come across the heated debate about the 18k BTC internal (or external) transfer to Gemini, from BlockFi, or somewhere. It’s really important for the market that we get this labelling of exchange wallets right but I hate to see these guys who provide us with this incredible data getting flamed on Twitter. What they do is really difficult so let’s back off okay?
I’ll be honest, the fact that the BTC Exchange Reserves hasn’t dropped back down is a little worrying, usually when BTC turns up to sell I’m looking to move some of my portfolio into Stablecoins so I can buy back lower.
Next we have the Stablecoin Exchange Reserves since December 2020:
The overall trend is up but recent activity shows that was a decline and it’s just starting to creep up slowly since then. I’m expected to get news of Tether minting fresh USDT and then see it (via this chart) transferred to exchanges ready to buy up that delicious BTC.
I’ll support it with the next chart which is Stablecoin Exchange Inflows Transaction Count, the number of Stablecoin deposits onto exchanges:

Here I actually see quite a few big spikes recently which calms me down and reassures me that we do have some fuel for the engine to push price higher.
The Spot Market
Each day, after looking at the general movement of Bitcoin and Stablecoins on and off exchanges, I want to get an idea of how much the Spot Market is involved in that activity. Both derivatives and spot have their own part to play in market movements but if I am seeing serious moves in the Spot Market, that is of greater significance to me in terms of price.
This is BTC Spot Exchanges Netflow, the difference between BTC flowing into and out of spot exchanges' wallets:

The most recent activity shows quite a lot of BTC flowing into spot exchange wallets, in fact the figure of the most recent largest orange bar is around 18k, the same figure reported in the Gemini debacle so I reckon that movement is showing on this chart and the wallet it was transferred to is labelled as an exchange spot wallet.
This is ETH Spot Exchanges Netflow:

Just massive outflows since January of ETH from spot wallets and despite the lagging price movement we’re seeing in ETH at the moment, this is bullish.
Let’s compliment it by ETH Exchange Reserves:

Which you can see has been in freefall since September 2020 and doesn’t show any signs of slowing down. I hope to broaden my understanding of what is going on here but an educated guess would be that it’s being locked up in ETH 2.0 staking.
Funding Rates
Heading over to Bybt now to check out funding rates and the derivatives market.
In the Chart Pro section of Bybt you can go to Bitcoin Funding Rates and get a trend of them using a bar chart.
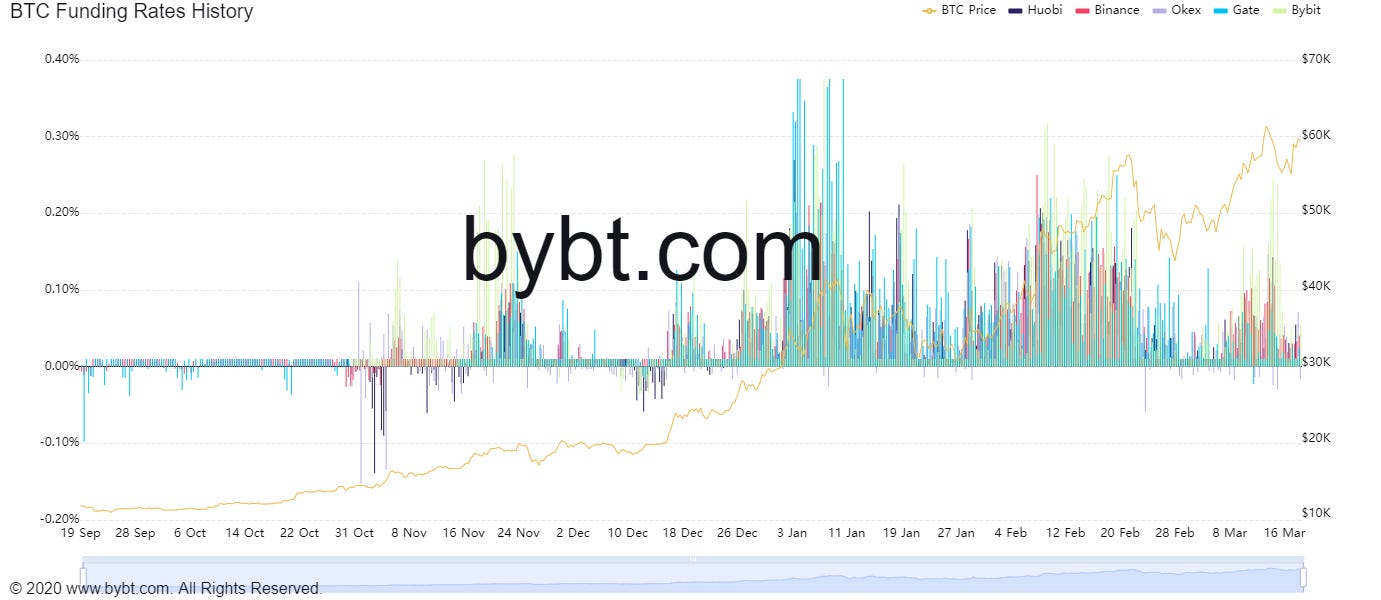
Learning about funding rates was a bit of a revelation to me and once I found out and understood what was going on here, I realised why I had been getting so rekt on leverage trading. I also stopped leverage trading and now just use them to predict when we might be approaching a dip.
When funding rates are high, the market is running hot, it means a lot of traders have long positions open and without getting too much into it now, because this post has already become quite long, it indicates a dip might be approaching.
Summary
I could not fit everything into this first post, actually I’m surprised by how much I was able to write. I’ll share other charts in future posts.
It’s difficult to draw a conclusion at the moment about the market and that therefore has to be my conclusion - that is, there are not really any crystal clear indicators of where the market will go and it’ll likely see some chop chop sideways action until some Bitcoin turns up to sell, Stablecoins are minted for buying, or Apes decide to push the price higher using derivatives.
Thanks for reading, chat in the comments!
Free Alpha!